Effective system monitoring is non-negotiable in today's complex IT environments. Netdata offers real-time performance and health monitoring with precision and granularity. But the key to harnessing its full potential lies in the optimization of your setup. Let’s ensure you are not just collecting data, but doing it in the most optimal way while gaining actionable insights from it.
13 posts tagged with "ml"
View All TagsDiscover The New Netdata!
Missed the last Netdata updates? Here is what is new:
Our first ML based anomaly alert

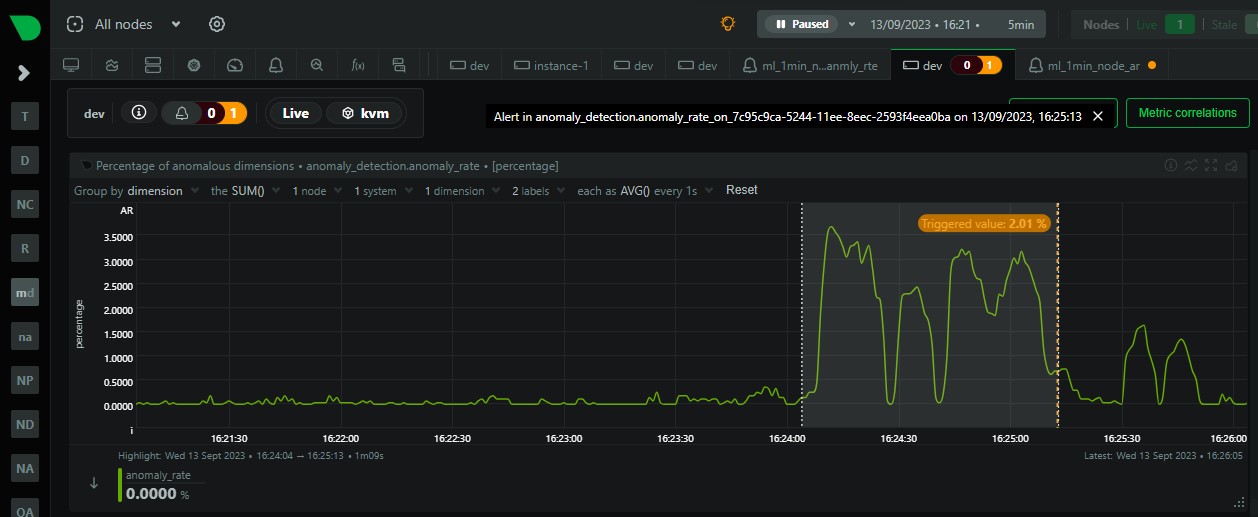
Over the last few years we have slowly and methodically been building out the ML based capabilities of the Netdata agent, dogfooding and iterating as we go. To date, these features have mostly been somewhat reactive and tools to aid once you are already troubleshooting.
Now we feel we are ready to take a first gentle step into some more proactive use cases, starting with a simple node level anomaly rate alert.
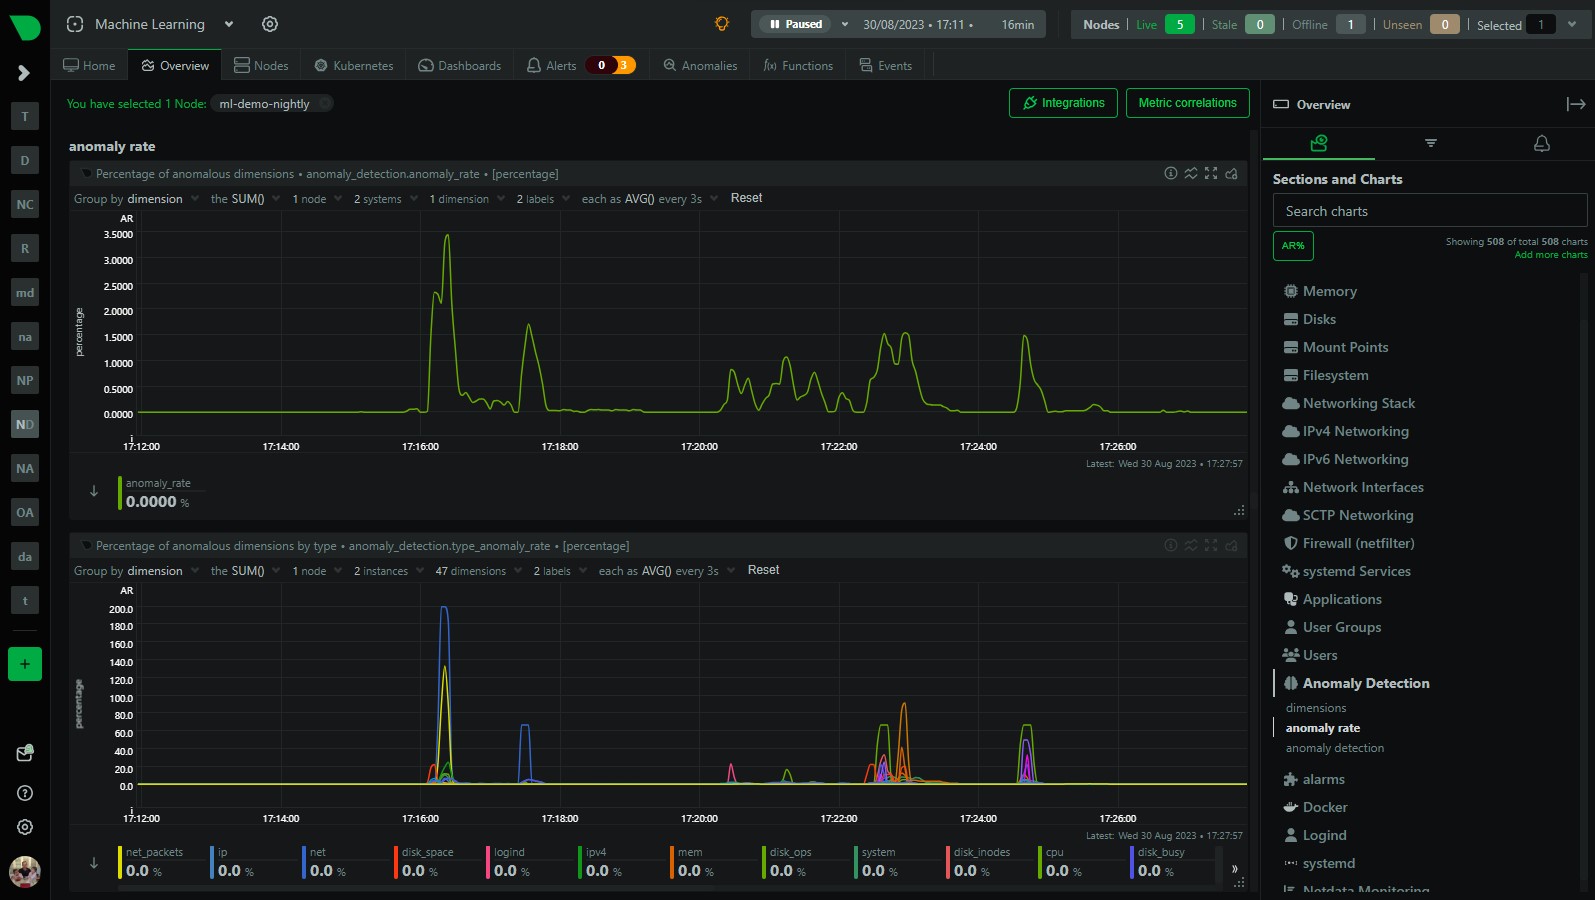
Anomaly Rate By Type

We have recently added a more detailed anomaly rate chart to Netdata that breaks out the overall node anomaly rate by type, this lets you more easily see what parts of your infrastructure might be experiencing an uptick in anomalies when you see the overall node anomaly rate increase.
Netdata Assistant: Your AI-Powered Troubleshooting Sidekick
Hey there! We're excited to share a new troubleshooting feature we have added to Netdata, the Netdata Assistant. We've built this tool to help you troubleshoot more effectively and with less stress. Let's dive in.
Netdata & Ansible example: ML demo room

We are always trying to lower the barrier to entry when it comes to monitoring and observability and one place we have consistently witnessed some pain from users is around adopting and approaching configuration management tools and practices as your infrastructure grows and becomes more complex.
To that end, we have begun recently publishing our own little example ansible project used to maintain and manage the servers used in our public Machine Learning Demo room.
This post introduces this project as a somewhat simple example of using Ansible with Netdata. Read on to learn more, but more importantly feel free to explore the repo and see how it all hangs together.
How Netdata's ML-based Anomaly Detection Works

How does Netdata's machine learning (ML) based anomaly detection actually work? Read on to find out!
Transforming Monitoring with a Machine Learning-First Approach
Unlocking the full potential of monitoring through ML integration, anomaly detection, and innovative scoring engines.
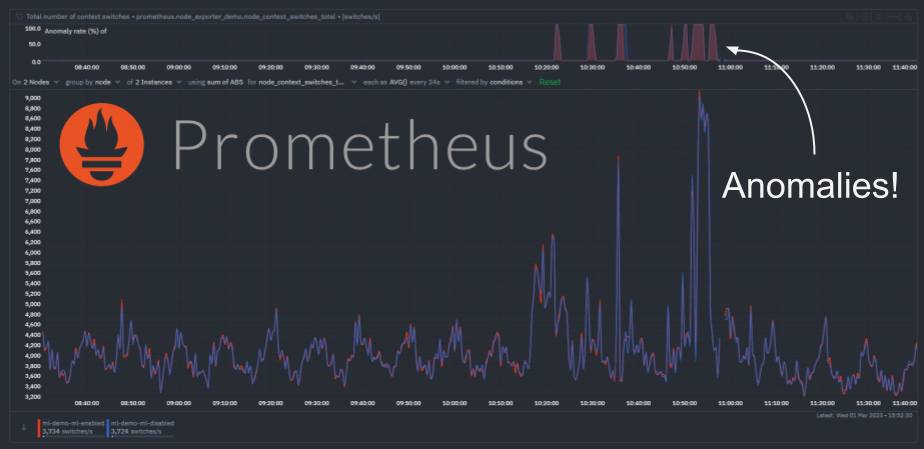
Anomaly detection on Prometheus metrics

We have recently extended the native machine learning (ML) based anomaly detection capabilities of Netdata to support all metrics, regardless on their collection frequency (update every).
Previously only metrics collected every second were supported, but now Netdata can run anomaly detection out of the box with zero config on metrics with any collection frequency.
This post will illustrate an example of what this means using Prometheus metrics (via the Netdata Prometheus collector) since they typically have a default collection frequency of 10 seconds.
How Netdata’s Machine Learning works
Following on from the recent launch of our Anomaly Advisor feature, and in keeping with our approach to machine learning, here is a detailed Python notebook outlining exactly how the machine learning powering the Anomaly Advisor actually works under the hood.
Anomaly rate in every chart
Metric Correlations on the Agent
As of v1.35.0 the Netdata Agent can now run Metric Correlations (MC) itself. This means that, for nodes with MC enabled, the Metric Correlations feature just got a whole lot faster!
Introducing Anomaly Advisor – Unsupervised Anomaly Detection in Netdata
Today we are excited to launch one of our flagship ML assisted troubleshooting features in Netdata – the Anomaly Advisor.
The Anomaly Advisor builds on earlier work to introduce unsupervised anomaly detection capabilities into the Netdata Agent from v1.32.0 onwards.